Gamma Correction
Definitions
Gamma
- Defines what the luminosity of a value represents.
- high value means darker image
- lower value means lighter image


Gamma Correction
- Act of applying a gamma value to an image
- Image side gamma encoding/correction
- Monitor side gamma decoding/correction
-
Initially, gamma correction was implemented because of the non-linear power-to-luminosity relationship inherent in CRT monitors
\[V_\text{out} = V_\text{in}^\gamma\]
Human Eye Luminosity Levels
- Human eyes are more sensitive to changes on darker shades
linear encoded

gamma encoded

- The jump between the first two pixels compared to the last two pixels in the linear encoded image is perceptually larger compared to the gamma encoded image.
Image Side Gamma Correction
- Applies a gamma correction to the image to efficiently utilise the bit range / depths
- Typically uses 1/2.2 as the default value which redistributes the brighter shades to the darker shades
- This is ideal as our eyes are more sensitive to darker shades so we want more data to represent it
- Some image formats allow gamma values to be stored as metadata
Monitor Side Gamma Correction
- CRT monitors have an exponential relationship with the input voltage and the output light intensity; usually around 2.5
- Monitors these days have a default gamma correction value of 2.2 to decode the image gamma encoding.
Overall Gamma Correction
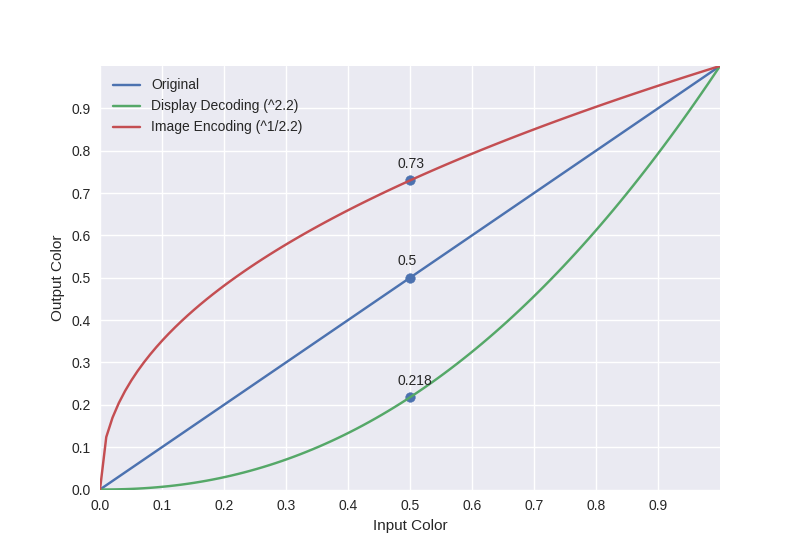
image_encoded_value = math.pow(0.5, 1/2.2) # 0.730
decoded_value       = math.pow(0.5, 2.2)   # 0.218
- as you can see from the graph above, with an input of value of 0.5, the value will be transformed to 0.73 in the image file and will be corrected by the display decoding of 0.218 it will have an overall value of 0.5
Lookup Table (LUT)
- Used to map the input to the approximate output of an expensive function
- Useful for very repetitive tasks such as gamma correction
- Can be done by dedicated hardware in the monitor
- Can be done by OS / software
import math

# { 0: 0.0,
#   1: 0.0012,
#     ...
#   254: 252.805
#   255: 255.0 }
def make_gamma_lut(min=0, max=255, steps=1, gamma=2.2):
    gamma_lut = {}
    for x in range(min, max+1, steps):
        gamma_lut[x] = 255 * math.pow(x/max, gamma)
    return gamma_lut
Appendix
# How to generate the PPM file
import math

MAGIC_NUMBER = "P2\n"
COMMENT = "# This is a greyscale ppm\n"

MAX_VAL = 255
MAX_VAL_STR = f"{MAX_VAL}\n"

def write_color(filename, exponent, bucket=11):
    image_x = bucket*100
    image_y = 100
    x_per_bucket = int(image_x/bucket)
    dimension = f"{image_x} {image_y}\n"

    with open(filename, "w") as f:
        f.write(MAGIC_NUMBER)
        f.write(COMMENT)
        f.write(dimension)
        f.write(MAX_VAL_STR)
        for y in range(image_y):
            for x in range(bucket):
                for xi in range(x_per_bucket):
                    f.write("%d "%(round(
                        math.pow(x/(bucket-1), exponent)*MAX_VAL
                    )))
            f.write("\n")

write_color("greyscale_linear.ppm", 1)
write_color("greyscale_gamma_encoded.ppm", 1/2.2)
# How to generate the graph
import matplotlib.pyplot as plt
import numpy as np
import math

plt.style.use('seaborn-v0_8')

# make data
x = np.linspace(0, 1, 100)

y_ideal   = x
y_display = np.power(y_ideal, 2.2)
y_image   = np.power(y_ideal, 1/2.2)

x_comparison = [0.5, 0.5, 0.5]
y_comparison = [x_comparison[0],
                math.pow(x_comparison[0], 2.2),
                math.pow(x_comparison[0], 1/2.2)]

# plot
fig, ax = plt.subplots()

# Make lines
ax.plot(x, y_ideal, '-', label="Original")
ax.plot(x, y_display, '-', label="Display Decoding (^2.2)")
ax.plot(x, y_image, '-', label="Image Encoding (^1/2.2)")

# Make points
ax.scatter(x_comparison, y_comparison)
for i, y_val in enumerate(y_comparison):
    ax.text(x_comparison[i]-0.02, y_val+0.03, round(y_val, 3))

ax.set(xlim=(0, 1), xticks=np.arange(0, 1, 0.1),
       ylim=(0, 1), yticks=np.arange(0, 1, 0.1))

ax.legend(loc="upper left")
ax.set_xlabel("Input Color")
ax.set_ylabel("Output Color")
plt.savefig("gamma_corrections_graph.png")
Written on July 20, 2024